chart-canvas
Create interactive visualizations and query data sources (SQLite, CSV, Parquet, JSON)
MCP 服务配置
复制以下 JSON 到 OPClaw 或其他 MCP 客户端的配置文件中即可使用
{
  "mcpServers": {
    "@gluip/chart-canvas-mcp": {
      "args": [
        "@gluip/chart-canvas-mcp@0.3.2"
      ],
      "command": "npx"
    }
  }
}
可用工具 (5 个)
该服务在 MCP 协议中暴露的工具,AI 可按需调用
tavily_search 14 个参数 需填 1 项
Search the web for current information on any topic. Use for news, facts, or data beyond your knowledge cutoff. Returns snippets and source URLs.
必填参数:query
tavily_extract 6 个参数 需填 1 项
Extract content from URLs. Returns raw page content in markdown or text format.
必填参数:urls
tavily_crawl 11 个参数 需填 1 项
Crawl a website starting from a URL. Extracts content from pages with configurable depth and breadth.
必填参数:url
tavily_map 8 个参数 需填 1 项
Map a website's structure. Returns a list of URLs found starting from the base URL.
必填参数:url
tavily_research 2 个参数 需填 1 项
Perform comprehensive research on a given topic or question. Use this tool when you need to gather information from multiple sources to answer a question or complete a task. Returns a detailed response based on the research findings.
必填参数:input
服务介绍
Chart Canvas MCP Server
Interactive visualization dashboard for AI assistants via Model Context Protocol
Create beautiful charts, diagrams, and tables directly from your AI conversations. Chart Canvas provides a real-time dashboard that displays visualizations as you work with LLMs like Claude.
# Demo
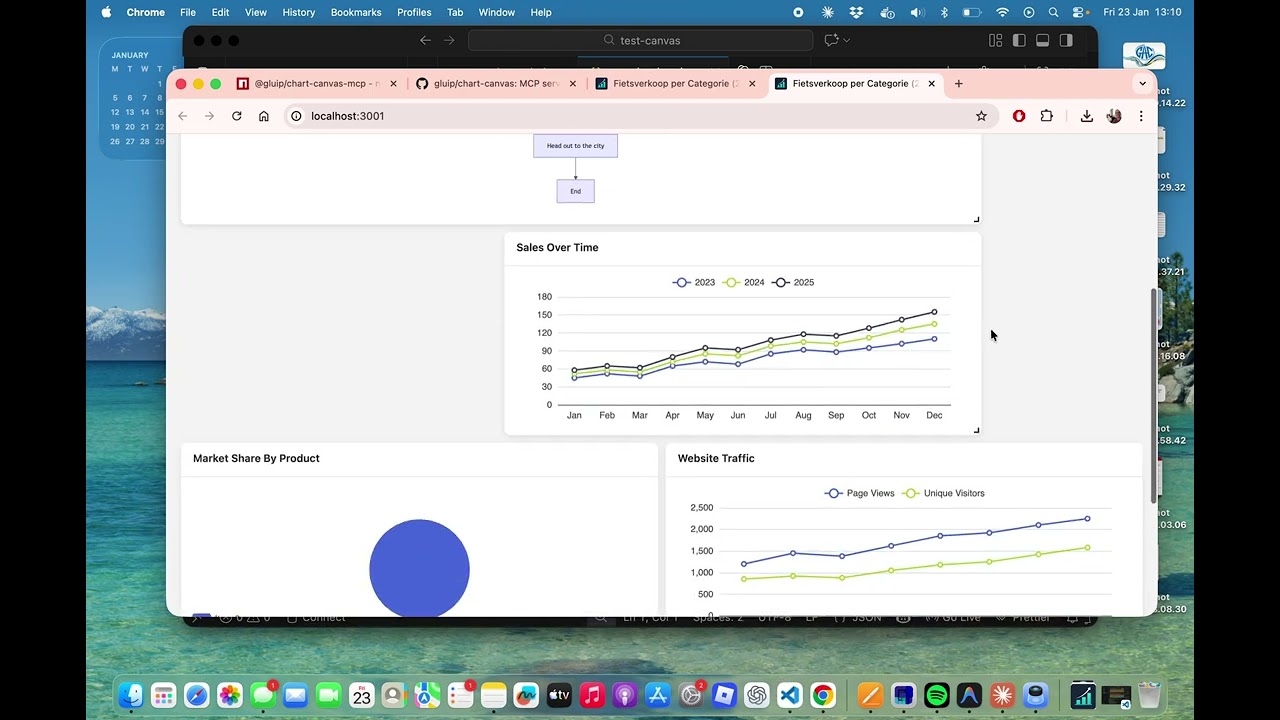
Watch the full demo on YouTube to see Chart Canvas in action!
# Features
✨ Multiple Chart Types: Line, bar, scatter, pie charts, tables, and Mermaid diagrams
🎨 Interactive Dashboard: Drag-and-drop grid layout with real-time updates
🔄 Live Synchronization: Changes appear instantly in your browser
📊 Rich Visualizations: Powered by ECharts and Mermaid
💾 Universal Data Sources: Query SQLite, CSV, Parquet, JSON, and NDJSON files directly
⚡ Smart Data Flow: Execute queries server-side - data stays local, never sent to LLM
🔒 Privacy First: Your data never leaves your machine
🚀 Easy Setup: One command to get started
🌐 Production Ready: Built-in production mode with optimized builds
# Supported Data Sources
Chart Canvas can query and visualize data from multiple file formats:
- SQLite (
.db,.sqlite,.sqlite3) - Relational databases - CSV (
.csv) - Comma-separated values - Parquet (
.parquet) - Columnar storage format - JSON (
.json) - JSON arrays of objects - NDJSON (
.jsonl,.ndjson) - Newline-delimited JSON
Privacy & Performance: All queries execute locally on your machine using DuckDB. Query results are transformed into visualizations server-side - only metadata (chart configuration) is sent to the LLM, never your actual data. This makes it fast, scalable, and private.
# Quick Start
# # Installation
npm install -g @gluip/chart-canvas-mcp
Or use directly with npx (no installation needed):
npx @gluip/chart-canvas-mcp
# # Configuration
Add to your MCP client configuration (e.g., Claude Desktop):
macOS: ~/Library/Application Support/Claude/claude_desktop_config.json
Windows: %APPDATA%/Claude/claude_desktop_config.json
{
  "mcpServers": {
    "chart-canvas": {
      "command": "npx",
      "args": ["-y", "@gluip/chart-canvas-mcp"]
    }
  }
}
# # Usage
- Start your MCP client (e.g., Claude Desktop)
- The server will automatically start on port 3000
- Use the
showCanvastool to open the dashboard in your browser - Ask the AI to create visualizations!
# Example Prompts
"Show me a line chart comparing sales data for 2023 and 2024"

"Create a pie chart showing market share by region"

"Draw a flowchart for the user authentication process"

"Make a table with team member information"

"Show me the database schema for my SQLite database"

"Query the athletes table and show the top 10 with most personal records"

"Create a chart showing sales trends from the database grouped by region"
# MCP Tools
# # addVisualization
Create charts, diagrams, and tables on the canvas.
Supported Types:
line- Line charts with multiple seriesbar- Bar charts for comparisonsscatter- Scatter plots for data distributionpie- Pie charts with labelstable- Data tables with headersflowchart- Mermaid diagrams (flowcharts, sequence diagrams, Gantt charts, etc.)
Example:
{
  type: "line",
  title: "Monthly Sales",
  series: [
    { name: "2023", data: [[1, 120], [2, 132], [3, 101]] },
    { name: "2024", data: [[1, 220], [2, 182], [3, 191]] }
  ],
  xLabels: ["Jan", "Feb", "Mar"]
}
# # removeVisualization
Remove a specific visualization by ID.
# # clearCanvas
Remove all visualizations from the canvas.
# # showCanvas
Open the dashboard in your default browser.
# # getDatabaseSchema
Inspect the structure of a SQLite database to understand available tables and columns before writing queries.
Parameters:
databasePath- Path to SQLite database file (e.g.,./data/mydb.sqliteor absolute path)
Example:
{
  databasePath: "/path/to/database.db";
}
Returns: Formatted schema showing all tables, columns, data types, and constraints.
# # queryAndVisualize
Execute a SQL query on a SQLite database and create a visualization from the results. Queries are executed server-side and must be read-only (SELECT only). Maximum 10,000 rows.
Parameters:
databasePath- Path to SQLite database filequery- SQL SELECT query (read-only)visualizationType- Type of chart:line,bar,scatter,pie, ortablecolumnMapping(optional for table) - Mapping of columns to chart axes:xColumn- Column for X-axis (required for charts)yColumns- Array of columns for Y-axis (required for charts)seriesColumn- Column to group data into separate series (optional)groupByColumn- Alternative grouping column (optional)
title- Optional title for visualizationdescription- Optional descriptionuseColumnAsXLabel- If true, use X column values as labels instead of numbers
Example:
{
  databasePath: "./data/sales.db",
  query: "SELECT region, SUM(revenue) as total FROM sales GROUP BY region",
  visualizationType: "bar",
  columnMapping: {
    xColumn: "region",
    yColumns: ["total"]
  },
  title: "Revenue by Region",
  useColumnAsXLabel: true
}
Security: Only SELECT and WITH (CTE) queries are allowed. INSERT, UPDATE, DELETE, DROP, and other modifying operations are blocked.
# Architecture
- Backend: Node.js + TypeScript + Express + MCP SDK
- Frontend: Vue 3 + ECharts + Mermaid + Grid Layout
- Communication: Real-time polling for instant updates
# Development
# # Local Development
#  Clone repository
git clone https://github.com/gluip/chart-canvas.git
cd chart-canvas

#  Install backend dependencies
cd backend
npm install

#  Install frontend dependencies
cd ../frontend
npm install

#  Development mode (backend + frontend separate)
#  Terminal 1 - Backend
cd backend
npm run dev

#  Terminal 2 - Frontend
cd frontend
npm run dev

#  Production mode (single server)
cd backend
npm run build:all
npm run start:prod
# # MCP Configuration for Local Development
{
  "mcpServers": {
    "chart-canvas": {
      "command": "/path/to/node",
      "args": [
        "/path/to/chart-canvas/backend/node_modules/.bin/tsx",
        "/path/to/chart-canvas/backend/src/index.ts"
      ]
    }
  }
}
# License
MIT © 2026 Martijn